

Energy Sector Investing – The LNG Megatrend
We last wrote about the energy sector back in November 2021 reflecting on the sector 15 months after the fall out from negative oils prices. In our reflection, we continued to highlight the integrated energy group as our high-conviction segment to benefit the most. Despite the correction in June, they have performed very well in 2022 continuing their recovery from the March 2020 low when Covid-19 hit. In this article, we will take a different angle by looking at what we believe is a multi-year megatrend – The global LNG (Liquefied Natural Gas) Value Chain in the energy market.
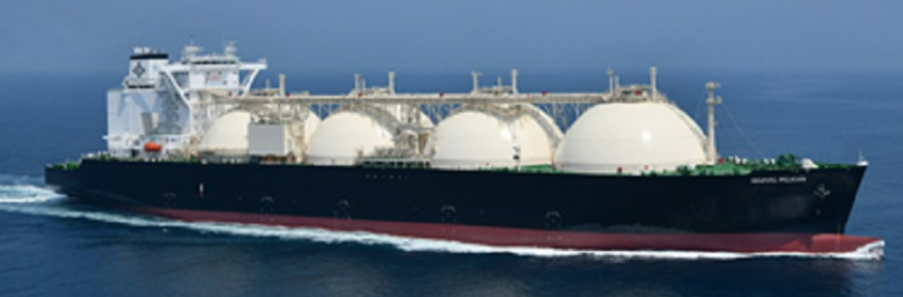
Picture of an LNG carrier “ Marvel Pelican “ built by Kawasaki Heavy Industries for Mitsui
Introduction to LNG
Compared to a typical upstream or Exploration &Production (E&P) segment (with thousands of players) and downstream Refining segment (hundreds of players), there are relatively few players with substantial exposure to the LNG value chain, especially within listed companies.
LNG is an industry dominated by the major IOC (International Oil Companies) and some of the NOC (National Oil Companies. The concentration reflects the high barriers to entry with high capital intensity, long lead times, and the need to discover substantial gas resources (to justify an LNG development). As a result, smaller E&Ps with sizeable gas resources are quiet often acquired prior to the development of the LNG project.
Another point worth noting is the robust capital discipline across the cycle, which is further reinforced by the need to contract off-take agreement before project sanction – no LNG plant or export capacity is built purely on a speculative basis.
However, as we shall discuss later, there are some less obvious players involved in the value chain who are not the producers or resource owners.
Some historical milestones for the LNG Market
- Between 1845-1873 - Natural gas liquefaction was first demonstrated by British scientist Michael Faraday in 1845. The first practical compressor refrigeration machine for natural gas was built in Germany in 1873 by engineer Karl Von Linde.
- In 1959 the world’s first LNG tanker, a converted World War II Liberty freighter called The Methane Pioneer, successfully carried an LNG cargo from Lake Charles, Louisiana, to Canvey Island in the United Kingdom.
- By 1969, three more LNG trades had started – a delivery from Algeria to France, one from Libya to Italy and Spain, and one from the Cook Inlet of Alaska to Japan, the first Pacific project. With the substantial slowdown in interest in LNG in the Atlantic, cheaper pipeline supplies from Northern Europe, and the old Soviet Union arriving in Europe, the balance of interest shifted entirely to the Pacific.
- Following the Oil Crisis of 1973, North Asia became the backbone of the global LNG industry. Japan expanded its LNG capabilities, building new terminals and contracting for supplies from various countries, including Australia, Brunei, Indonesia, Malaysia, Qatar, and the United Arab Emirates (UAE). Korea became the second major Asian importer in 1980, followed by Taiwan in 1990, leading Asia to dominate world LNG consumption
The first cargo of LNG from Australia’s North-West Shelf project operated by Woodside was delivered to Japan in 1989. This year marked the 33 anniversary of the LNG industry in Australia.
- By the late 1980s, countries in Europe that were further from the vast Russian gas fields regained interest in LNG. By the mid-1990s, Europe — led by Spain, France, Italy, Turkey, and Belgium — became a growing consumer of LNG.
- In last decade, North Asian markets are the growth engine of the LNG trade through the growth of gas-fired power generation, taking market share from coal, fuel oil and nuclear the trend accelerated after the Fukushima nuclear accident in Japan 2011. Some European countries began to import LNG such as Spain and Portugal furthest away the reach of pipelines transporting gas from Russia, also from to diversify their sources of supply I this case pipelines from Algeria.
- Further activity in the last decade saw the growth of new markets importing LNG. New LNG importing markets included Brazil in South America and the Indian subcontinent led by India and now Pakistan. Even in the hydrocarbon-rich Middle East countries like Kuwait and Turkey are importing LNG. Imports into other parts of South America also continued to expand.
- The most significant development, in last decade, has been on the supply side where the United States transitioned from an importer to one of the largest exporters of LNG. The excess supply of shale gas production has driven the transition to a significant exporter. Australia, Qatar, and Russia also significantly expanded LNG exports.
From Long-Term 20 year + contracts to the rapid rise of the spot market
In the early years LNG projects only proceed if there if 20 years plus contracts were put in place. There were two critical factors for the need of 20 plus contracts. Firstly, all the LNG plants globally were entirely built based on supplying to the end customers that long -term supply deals - originally Japanese utilities with 20-year-plus contracts, typically with an oil-linked price clause. Secondly, the enormous capital cost required to get the LNG projects off the ground required certainty with long-term contracts
Over the last two decades, we saw risk-taking commodity trading houses such as Vitol and Trafigura taking positions in shorter-term LNG contracts. The short-term contracts led to a growing spot market in LNG. Nowadays, the spot market account for around 15-30% of the LNG trade compared to less than 10% a decade ago.
While long-term contracts with cornerstone customers will likely continue to dominate global LNG sales, the rise of spot markets presents risks and opportunities for the sector.
The LNG Value Chain
Looking at the different links in the value chain: the starting point is natural gas production and exploration, then liquefaction and storage, shipping, and lastly receiving end with regasification and distribution. This is best depicted by the following diagram. The chain starts off with the exploration and production of natural gas and includes extracting unprocessed natural gas from gas reserves, on-site processing, and bringing the gas from the site of extraction to a processing facility
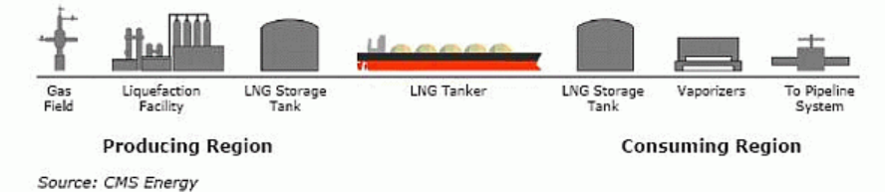
The feed-gas is first cleaned from impurities and liquids to reach certain specifications. It is then sent to a liquefaction plant for pre-cooling and liquefaction, and finally stored and prepared for transportation. The LNG is transported in large quantities by designated ships called LNG carriers. LNG loading takes place at the exporting site before the gas is shipped to an onshore receiving terminal with receiving capabilities. It is then regasified (regasification is the process of converting LNG at a temperature of -162 degree Celsius back into natural gas at atmospheric temperature) and prepared for distribution to a gas network, where it can be utilized for example power generation.
Current State of the Global LNG Markets
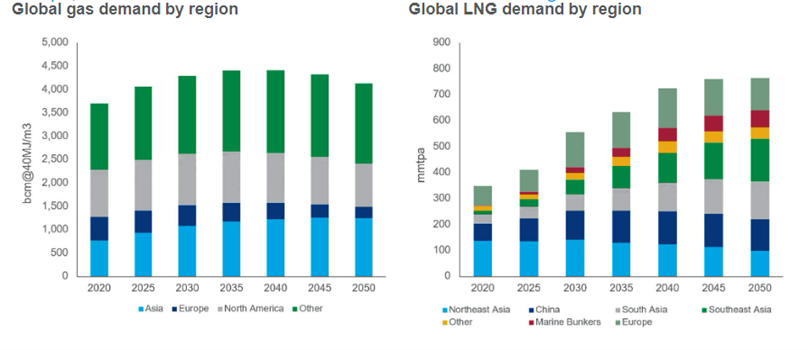
In 2021 and 2022, the LNG market returned to growth after demand dropped in 2020 with the health pandemic. LNG imports grew at 4.5% to reach 372.3 MT. The demand was driven by China and Korea increasing imports by 7.1%. The future demand profile looks very positive with Wood Mackenzie’s most recent forecast:
Source: Wood Mackenzie
The acceleration in demand will be driven by importers wanting enhanced energy security with a pathway of energy transition to net-zero. Later in the article, we will discuss these critical factors in more detail.
LNG exporters dominated by three countries with Asia and Europe leading importers
There is a group that is unchallenged by all other that are the dominant exporters of LNG. Qatar, Australia, and US are the big three, with Russia and Malaysia next, but quite a gap behind.
The biggest importers are Japan, China, and Korea, followed by India and Taiwan, while Spain and France are the two largest importers in Europe. The rank of importers is growing by the year with Croatia the last country to join this group which now numbers 44 countries versus 19 exporting countries.
Based on actual numbers in 2021 (all in metric million tonnes) from various published data.
Top 5 Exporting Nations
| Actual Volume | Nameplate Capacity | ||
|---|---|---|---|
| 1 | Australia | 78.5 | 87.6 |
| 2 | Qatar | 77.0 | 77.4 |
| 3 | USA | 67.0 | 71.6 |
| 4 | Russia | 29.7 | NA |
| 5 | Malaysia | 27.94 | 30 |
The next 5 are –(numbers in brackets actual exported in 2021) No 6 Nigeria (16.42), 7 Indonesia (13.82), 8 Algeria (11.78), 9 Oman (10.22) and 10 PNG (8.3)
Top 5 Importing Nations
| Actual Volume | Nameplate Capacity | ||
|---|---|---|---|
| 1 | China | 79.3 | 83.8 |
| 2 | Japan | 74.4 | 227.1 |
| 3 | South Korea | 46.9 | 102.5 |
| 4 | India | 24 | 47.5 |
| 5 | Taiwan* | 19.4 | 15.5 |
TNB: Ranked No 5, Taiwan has the highest utilization rate of LNG regasification globally at >125% in 2021 as shown above.The next 5 are (numbers in brackets actual imported in 2021) No 6 Spain (13.82), 7 France (12.34), 8 UK(11.04), 9 Turkey (9.99) and 10 Pakistan(8.19)
LNG Liquefaction plants and Export Terminals increasing capacity and utilisation
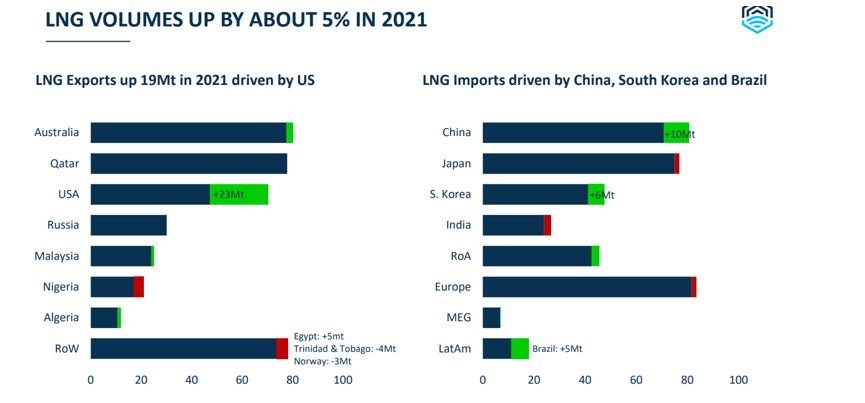
Based on the latest available data, about 6.9 million tonnes per annum (MTPA) of liquefaction capacity was brought online in 2021, increasing global liquefaction capacity to 459.9 MTPA at the end of the year. Average global utilisation rate further increased in 2021 at 80.4% versus 74.6% in 2020. An additional 12.5 MTPA of liquefaction capacity was brought online in the first four months of 2022.
Fastest exporting growth witnessed in the US
In 2021, incremental LNG supply from the United States (+22.3 MT) accounted for more than the total global incremental supply (+16.2 MT). Imports from the United States grew by 49.8%, thanks to the ramp-up of five large liquefaction projects commissioned in 2020 (Cameron LNG Trains 2 and 3, Corpus Christi LNG Train 3, Freeport LNG Trains 2 and 3) as well as to the commissioning of Sabine Pass Train 6 in 2021. New supply was also added by Egypt (+5.2 MT), Algeria (+1.2 MT), Malaysia (+1.1 MT) and Australia (+0.8 MT). Besides Sabine Pass Train 6, other supply additions in 2021 included Yamal Train 4, PFLNG Dua in Malaysia and the restart of operations of Damietta in Egypt.
The highlights the export growth for the US market:
Source: Flex LNG
Floating Liquefaction Plants (FLNG) adding to the capacity mix
As opposed to land-based liquefaction plants – another significant development has been the FLNG -offshore floating platforms incorporating liquefaction. FLNG saves the need to build undersea pipelines to land-based liquefaction. However, as of April 2022, there have been only four such operating units globally, adding up to just 8.7 MTPA or less than 2% of total capacity. It is nevertheless something worth watching for more adoption. The largest project is Prelude Shell in Australia (3.6 MTPA), currently out of action due to a fire. Petronas Malaysia has two units PFLNG One (1.2 MTPA) and PFLNG Two (1.5 MTPA). ENI-operated Coral Sul FLNG in offshore Rovuma Basin Mozambique should begin operation later this month with 3.4 MTPA, and this will be the world’s deepest FLNG project and bring the total FLNG capacity in operation to 12.1 MTPA. Once in production, Mozambique will be the No 20 LNG exporting country.
The FLNG sector remains at an early stage of development. Several projects in both Africa and Latin America have been delayed partly due to Covid-19.
The next unit to come onstream in 2023 is Golar LNG’s, which is 80% completed at the Singapore shipyard.
LNG Receiving Terminals extra capacity with alternate solutions
At the end of 2021, global regasification capacity reached 993 MTPA. Seven new regasification terminals started commercial operations in 2021, totalling 22.6 MTPA of capacity. One large-scale onshore terminal was commissioned in Kuwait, two small-scale terminals in Italy, and one in Mexico. Three floating terminals started commercial operations in 2021, respectively, in Brazil, Croatia and Indonesia. Croatia joined the ranks of LNG importing countries in 2021. Five expansion programs were completed during the year: four in China and one in Japan, adding around 10 MTPA of regasification capacity.
49.8 MTPA of regasification capacity was added in 2021 with the commissioning of five new import terminals and the completion of 5 expansion projects at existing terminals. By April 2022, global regasification capacity has reached 901.9 million tonnes per annum (MTPA).
In the past five years, European markets have been slow in adding regasification capacity despite accounting for almost 20% of the global regasification capacity. Croatia became a new LNG importer in 2021, as operations started at the Krk LNG terminal with the arrival of a 1.9 MTPA FSRU. Significant capacity has also been added in Turkey since 2018
As for 2022, we expect the US to see the biggest growth in export volume. Among the European markets with potential additional import capability, Germany has plans to add the most regasification capacity, at 13.2 MTPA. In addition, it revealed plans to build two LNG terminals in Brunsbuttel and Wilhelmshaven in February 2022 to lessen its dependence on Russian gas. German energy major Uniper will build and operate the LNG terminal at Wilhelmshaven. The FSRU, with a capacity of 7.3 MTPA, is expected to cover around 8% of Germany’s gas demand in the future. The project is expected to be completed in two phases – by the end of 2022 and 2025, respectively.
The increasing role played by Floating Storage Regasification Units (FSRU). FSRU are either converted from old LNG vessels or new builds. Natural gas is produced at a gas field and is then sent to an FLNG barge or a land-based liquefaction plant to be liquefied. The resulting LNG is then carried in a vessel to a FSRU or land-based terminal for regasification. The natural gas is then delivered to onshore markets. With an ability to import LNG with a 'plug-and-play’ solution, FSRUs offer the flexibility of meeting demand as and where it is needed before being redeployed elsewhere.
FSRU is the quickest way for a country(buyer) to start receiving LNG versus the traditional plants. A comparison between Land-based regasification and FSRU highlighting FSRU’s the speed to below is shown below:
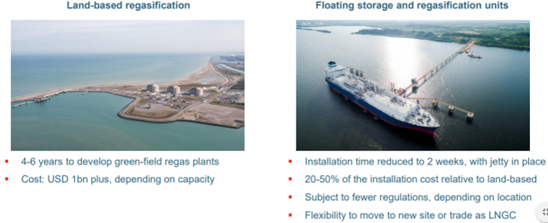
More emerging market countries are likely to import LNG using FSRUs. Developed Countries needing quick access like Germany and Australia are embarking on this method hoping to resolve impending gas shortage crisis.
LNG Shipping a vital link between exporting countries and importers
LNG ships obviously enable LNG delivery from exporter to importer. Historically, LNG shipping involves a Supply Point A to Demand Centre B fixed “milk run”. The number of ships ordered was simply to match the yearly contracts of an LNG project. As the industry grew, it further developed into “unlocking ships from such fixed routes, the basic role of LNG ships evolved to enable LNG suppliers to capture regional price arbitrage and to help optimise overall portfolio returns. As such, LNG ships have become more valuable and strategically important assets
The current fleet size with 68 new vessels delivered in 2021 (versus 47 delivered in 2020), the LNG shipping fleet reached 700 vessels, including 48 FSRUs and 64 vessels (31 LNG bunkering vessels + 33 LNG carriers of less than 50,000 cubic meters) and representing a 9% increase in cargo capacity. Total cargo capacity at the end of 2021 stood at 104.1 million cubic meters. Total operational capacity (vessels known to be in service) amounted to 103.0 million cubic meters. Freight rates remained very strong throughout 2021. The average spot charter rate for a 160,000 cubic meter LNG carrier stood at around $89,200/day, compared to an average of around $59,300/day in 2020.
The orderbook at year end was remarkably high, with 196 units to be delivered by 2025.
Energy Security and Transition accelerated Global LNG demand
Throughout of 2021 and 2022, we have witnessed an acceleration in demand for gas prices. With the rising gas prices, there has been increased volatility, with significant price spikes in the last quarter of 21, the first and second quarter of 2022, and another one emerging in the current third quarter of 2022. The following chart shows the spot LNG prices from Q2 2020 to now:
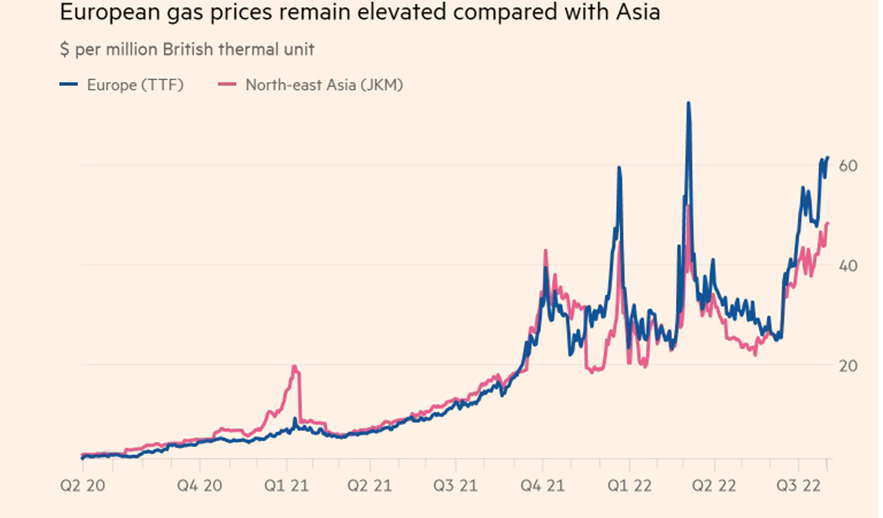
Source: FactSet and Financial Times
The fourth quarter of 2021 price spike was related to the European energy crunch, a combination of demand and supply side events. The demand side was lriven by a colder winter in the UK and increased industrial energy consumption with the post-COVID19 economic recovery. On the supply side, the UK had lower average wind power generation, Norway had lower rainfalls reducing hydropower, and several non-renewable power generation plants in Europe being offline due to unexpected maintenance. All the price spikes in 2022 have been related to the Ukraine conflict, which has completely disrupted the supply side of the energy market globally, especially all countries that are net importers of energy. The disruption has led nations to re-think energy security needs in a world where geopolitical conflicts could be ongoing. The re-think has hit European nations the hardest, especially Germany and Italy, who are heavily reliant on Russian gas supplies to help them transition to renewable energy over the coming decades.
To increase energy security, Europe has chosen a path to remove its reliance on Russia with the proposed targets:
- Reduce the EU demand for Russian gas by two-thirds before the end of 2022.
- Eliminate the EU’s Russian dependence before 2030.
- Mandatory 80% Storage fill in EU by 1 Oct 2022, 90% each year thereafter.
Such initiatives and remaining on the energy transition pathway to net-zero emission have brought the Global LNG value chain into the spotlight and shown its critical role in meeting these targets. LNG remains the best short-term solution for Europe to secure its energy security, as supply can be mobilised from other parts of the world quickly and at a reasonable cost through alternate solutions the global LNG value chain has available.
The targets are challenging. We believe they are aspirational, as, in practice, one is impossible, two and three difficult. However, alternate LNG solutions would be moving Europe off the energy transition pathways or too costly.
These aggressive targets will accelerate demand within the Global LNG Value Chain over the next ten years, driving returns. However, there will be risks within the value chain where stakeholders are trying to take advantage of hot prices in the LNG spot markets, and investors must be aware of not being caught out in a volatile megatrend.
Where are listed players in the LNG Value Chain?
To summarise we can broadly divide them to these different types which represent the six ways to play the LNG megatrend.
Group A- Producers /Exporters of LNG
Producers and exporter companies are the companies that own the gas resource and produce it. For listed companies there are two segments the major integrated energy companies and the large producers (E&P). The most well-known major integrated include Shell, TotalEnergies, ExxonMobil and Chevron. While for the large E&P we have as ConocoPhillips ,Woodside and Santos, Inpex or CNOOC.
Below are the top ten companies globally by Exporting (storage) capacity as of June 2021 in millions of metric tonnes per annum.
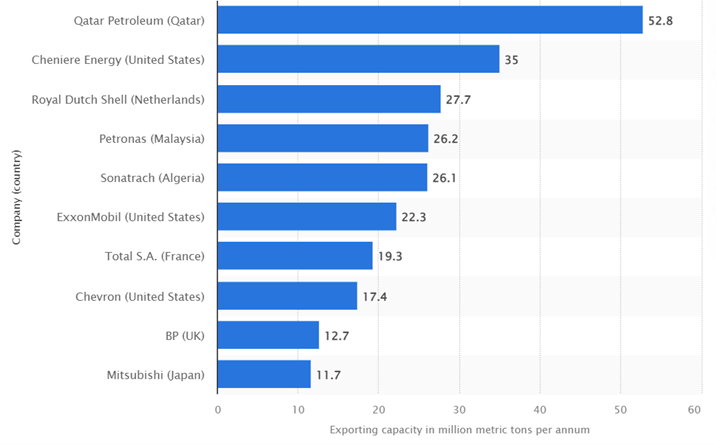
Source:Statista June 2022
Three of the top exporting companies are not listed on the public markets. These include Qatar Petroleum , Petronas, and Sontrach, which are state-owned companies. The only company in the top ten that is not a pure energy company is Mitsubishi Corporation Japan, which is a conglomerate that actively invests in energy projects. Other companies that are top tier exporters/producer that are not in top ten are Woodside Australia and ConnocoPhilips US.
Group B - Infrastructure Companies
These companies own the infrastructure – the liquefaction plants and the export facility or the regasification or receiving terminal, which we would include the FSRU (Floating Storage Regasification Unit).
The owner and operators include major oil and gas producers, utilities, and independent infrastructure owners. The oil and gas producers, such as Shell and Woodside, own the liquefication plants and export facilities. The utilities, listed companies or state-owned, operate and own the import terminals.
The independent infrastructure may own various parts of the LNG infrastructure. The best-known ones are Cheniere Energy and Venture Global (not listed) in the US on the export side and Petronet India (listed and owned by a collection of oil companies and utilities who are the customers) on the import side. Another prominent player here is New Fortress Energy US, which owns more than the regasification plants but other associated assets, including power plants and is now expanding into upstream infrastructure.
Group C - LNG Shipping Companies
These companies own the LNG vessels that ship the LNG across the ocean from exporting to importing countries. Most of these ships are owned by large producers or national energy companies. For producers largest is Qatar Energy , which owns a fleet of the largest type of LNG vessels known as Q-max, and others like Shell and TotalEnergies.
The national energy companies that ship LNG and own large fleets are Petronas Malaysia’s shipping subsidiary MISC and China’s Cosco Shipping Energy Transport (CEST). Both these companies are listed entities.
Two other groups operate LNG vessels. The first group is the three largest diversified shipping companies, which include Japanese Mitsui OSK (MOL), Nippon Yusen (NYK) and Kawasaki Kisen (K-Line). All own LNG vessels, and we believe MOL has the most LNG vessels. The second group is independent operators, which includes Flex LNG Norway and Golar LNG are the largest two. In addition, Golar LNG is diversifying into floating LNG platforms and FSRU. All the companies in these two groups are listed entities.
Group D - LNG Vessels and FSRUs
These companies that specialise in ship building of LNG vessels. The industry is dominated by the Korean, China, and Japanese companies. The Korean companies, include three majors Samsung Heavy, Daewoo and Hyundai. The Japanese majors are Mitsubishi Heavy and Kawasaki Heavy of Japan.
Group E -Design and build LNG plants
These companies are involved in the design and building process for liquefaction plants, regasification units, and offshore platforms. The work encompasses services, such as design, engineering, construction, and quality assurance. The leading companies delivering these services include Chiyoda, JGC both of Japan, and Worley of Australia.
Group F - Critical technology
These companies are providing critical technology in the value chain process for LNG. There three critical technologies vital the process and each segment have companies leading the market space. The process and leading companies include:
- The liquefaction process technology -Air Products and ConocoPhillips
- LNG containment system -GTT of France.
- Propulsion system, turbines etc - Wartsila of Finland.
Global Infra-Energy Fund Exposure
The exposure our Global Infra-Energy Fund has in the LNG Value Chain includes:
| Producers | Integrated Majors Shell, TotalEnergies , Equinor , Chevron and Exxon Mobile Producers (E&P) – ConocoPhillips, Woodside Petroleum, Santos |
| Infrastructure | Infrastructure plays-Cheniere Energy and New Fortress Energy |
| Shipping | LNG Shipping and related – Cosco CSET, Flex LNG |
| Shipbuilding | LNG Shipbuilding company - Kawasaki Heavy Industries |
| LNG E&C | LNG plant E&C company - JGC Corp Japan |
| LNG Technologies | LNG containment - GTT France Liquefaction technology - Air Products |
In total, approximately 20% of the portfolio has exposure to the LNG megatrend via the above companies
NB One area we would prefer to avoid is many of the downstream companies that purchase LNG because it is very much a sellers’ market that sets the price for LNG, days when buyers have the upper hand in price negotiation are gone. This typically applies to many utilities in Japan, Korea and some in Europe. A number of the integrated energy we invest in are also buyers of LNG, but they are more diversified business model.
In conclusion we would highlight the following:
- Global LNG as an industry will be a major megatrend for this decade and beyond. Its demand growth will likely peak much later than oil among fossil fuels. Previously seen as a transitional fuel toward net zero carbon emission, recent events have highlighted the “Energy Security“ aspect and gas’s critical role in the energy mix cannot be overlooked.
- High LNG prices will likely persist for at least 2-4 years, given the European demand in competition with traditional Asia Pacific markets.
- Based on our experience at RC Global Funds Management - a basket of equities relating to the Global LNG theme has outperformed the overall MSCI Energy or MSCI Industrial sectors for different periods looked at over the past year, including the recent June correction. It should continue to do so in the coming two years at least. Such a portfolio should also lower the volatility of owning energy equities.
Like what you're reading? Subscribe to our top insights.
Follow us on Linkedin.
Roy Chen
Chief Investment Officer for the Global Infra-Energy Fund
3 Comments
-
 Dave Austin 1 day ago
As a Special Education teacher this resonates so well with me. Fighting with gen ed teachers to flatten for the students with learning disabilities. It also confirms some things for me in my writing.
Reply -
 Christina Kray 2 days ago
Since our attention spans seem to be shrinking by the day — keeping it simple is more important than ever.
Reply
Post a comment


Like to organise a meeting
To discuss investing in our global managed equity funds.